



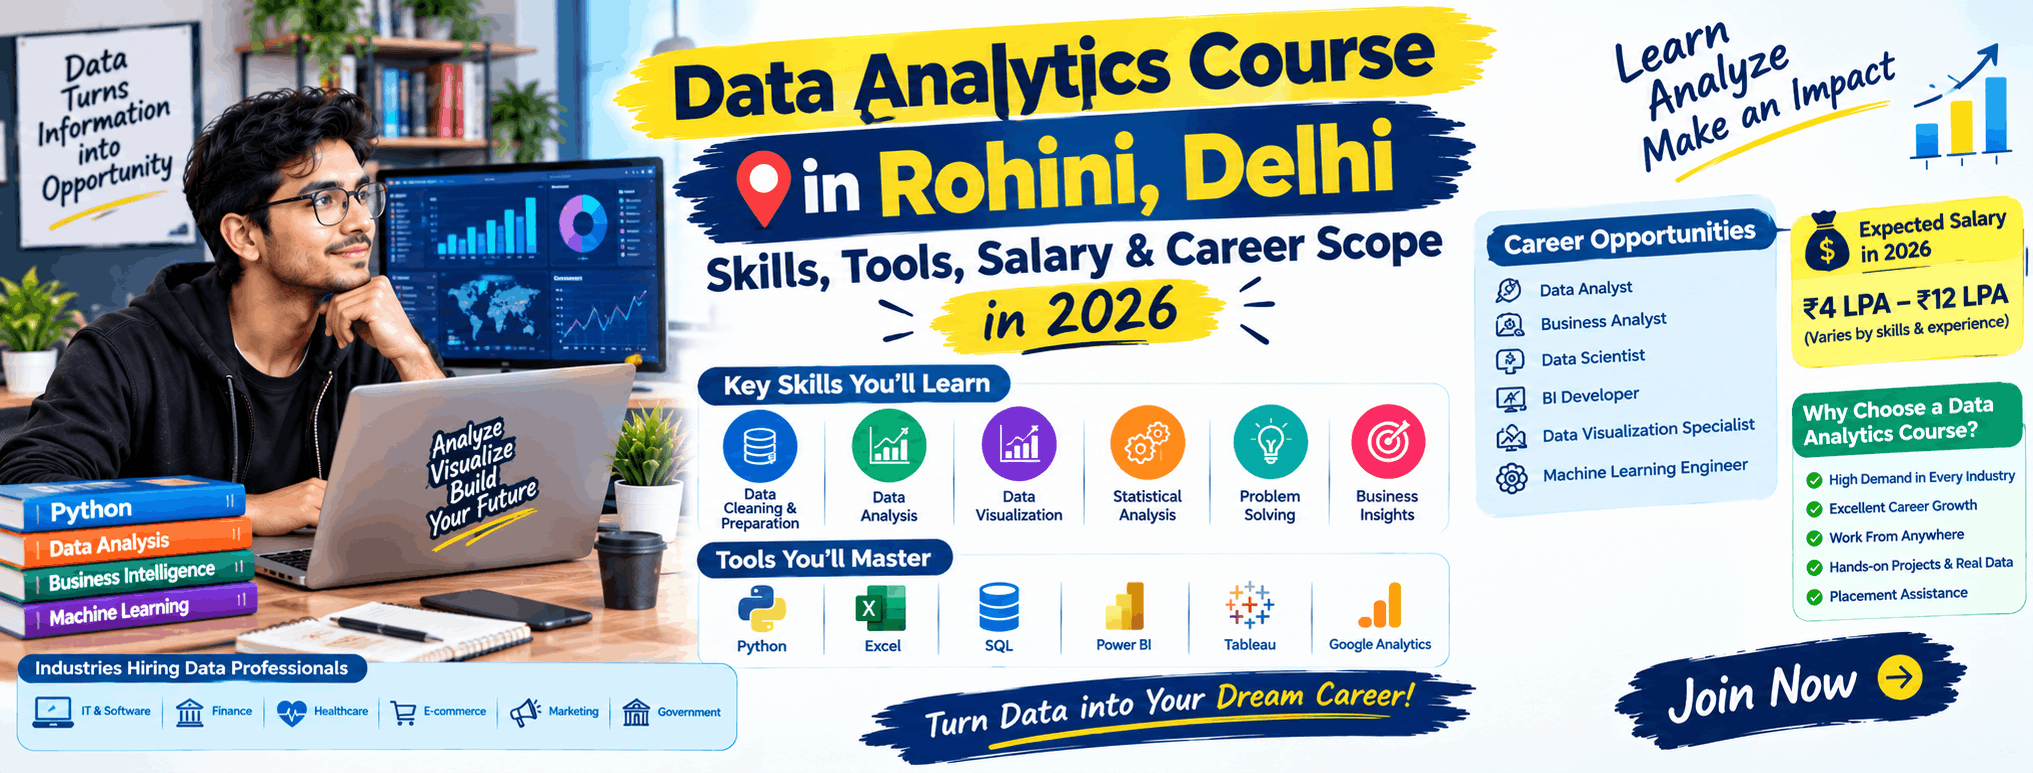
Data Analytics Course in Rohini: Skills, Tools & Scope 2026
Data has quietly become the backbone of almost every business decision, from what products get launched to how marketing budgets are spent. If you are exploring a data analytics course in Rohini, you are probably wondering what you will actually learn, which tools matter, and whether this field is worth the time and money in 2026. This article breaks down the real skills employers expect, the software you need to practice on, a realistic learning path, and the kind of career opportunities data analytics can open up. We will also cover common mistakes beginners make and answer practical questions students usually ask before enrolling. By the end, you should have a clear, honest picture of what it takes to become job-ready as a data analyst.
Why Data Analytics Is Gaining Attention in 2026
Every industry, from retail and healthcare to logistics and finance, now generates large amounts of data through apps, websites, transactions, and customer interactions. Businesses need people who can turn this raw data into readable insights that guide decisions. That demand is why data analytics continues to be one of the most searched career paths among students and working professionals looking to upskill.
Unlike a purely technical coding career, data analytics also rewards people who are good at logical thinking, storytelling with numbers, and asking the right business questions. This makes it accessible to students from commerce, science, and even arts backgrounds, not just engineering graduates.
Core Skills You Need to Become a Data Analyst
A good data analytics course should build both technical ability and analytical thinking. Here are the core skills that matter most:
- Statistics and probability basics - understanding averages, distributions, correlation, and probability helps you interpret data correctly instead of jumping to wrong conclusions.
- Excel for data handling - pivot tables, VLOOKUP/XLOOKUP, conditional formatting, and basic formulas are still widely used for quick analysis in real jobs.
- SQL for querying databases - most business data lives in databases, so knowing how to write queries to extract and filter information is non-negotiable.
- Data visualization - being able to build clear charts and dashboards that non-technical managers can understand quickly.
- Python or R basics - useful for cleaning large datasets, automating repetitive tasks, and doing deeper statistical analysis.
- Business communication - explaining what the data means in plain language is often more valuable than the analysis itself.
A common mistake beginners make is trying to learn everything at once. It is better to get comfortable with Excel and SQL first, since they form the foundation for almost everything else in analytics.
Must-Know Tools and Software
Tools change how efficiently you work, but they cannot replace strong fundamentals. Still, employers expect hands-on familiarity with a few standard tools:
- Microsoft Excel - for day-to-day reporting and quick analysis
- SQL (MySQL, PostgreSQL, or SQL Server) - for querying structured data
- Power BI or Tableau - for building interactive dashboards and visual reports
- Python (with Pandas, NumPy, Matplotlib) - for data cleaning, analysis, and automation
- Google Sheets and Google Analytics - useful if you plan to work closely with marketing or web data
You do not need to master every tool before applying for jobs. Most companies expect strong Excel and SQL skills at minimum, with Power BI/Tableau and Python as strong additional advantages.
Building a Data Analytics Portfolio
A portfolio is what separates a candidate who "took a course" from one who can actually demonstrate skill. Recruiters increasingly ask for project links or a portfolio during interviews, so this should not be an afterthought.
What to include in your portfolio
- 2-3 real or public datasets analyzed end-to-end, showing your process, not just the final chart
- At least one interactive dashboard built in Power BI or Tableau
- One SQL-based project showing queries used to extract insights from a database
- A short written summary for each project explaining the business question you were solving
Where to find practice datasets
Public data sources related to sales, e-commerce, transport, or government open data portals are good starting points. Working on Indian datasets can also help you speak to local business context during interviews.
A Practical Learning Path for Beginners
- Start with statistics fundamentals and Excel
- Learn SQL and practice writing queries on sample databases
- Pick one visualization tool (Power BI or Tableau) and build 2-3 dashboards
- Learn Python basics for data cleaning and analysis
- Work on 3-4 portfolio projects using real or public datasets
- Practice explaining your findings in simple, business-friendly language
Trying to learn Python before understanding basic statistics is a common mistake. Concepts stick better when you understand why you are doing something, not just how to code it.
Career Scope and Job Roles in 2026
Data analytics is not a single job title; it is a skill set used across many roles. Some common career paths include:
- Data Analyst - reporting, dashboards, and business insights
- Business Analyst - bridging business needs with data-driven solutions
- Marketing Analyst - analyzing campaign performance and customer behavior
- Operations/Supply Chain Analyst - improving efficiency using data
- Junior Data Scientist - for those who go deeper into statistics and machine learning later
Freelance opportunities also exist, especially for dashboard building, data cleaning, and reporting projects for small businesses that cannot afford a full-time analyst. Regarding salaries, figures vary widely based on city, company size, and experience, so rather than quoting numbers here, it is best to research current listings on job portals or ask a training institute's placement team for the latest regional trends.
Data Analytics vs Data Science: Where Do You Fit?
Many beginners confuse these two fields. Here is a simple comparison to help you decide where to start:
| Aspect | Data Analytics | Data Science |
|---|---|---|
| Main focus | Interpreting past and current data for decisions | Building predictive models and algorithms |
| Core tools | Excel, SQL, Power BI/Tableau, basic Python | Python/R, Machine Learning libraries, advanced statistics |
| Math depth | Moderate | Higher, includes linear algebra and calculus concepts |
| Good starting point for | Commerce, business, and beginner tech learners | Those comfortable with coding and advanced math |
| Typical output | Reports, dashboards, insights | Predictive models, algorithms, automation systems |
Most learners start with data analytics and move toward data science later if they enjoy the coding and mathematical side of the work.
Choosing the Right Data Analytics Course in Rohini
If you are comparing institutes for a data analytics course in Rohini, check for a few practical things before enrolling:
- Does the course include hands-on practice with Excel, SQL, Power BI/Tableau, and Python, not just theory?
- Are you working on real or realistic datasets and projects, not just watching recorded lectures?
- Do trainers give feedback on your dashboards and analysis, or is it self-paced with no guidance?
- Is there support for resume building, mock interviews, or portfolio review?
If you want structured classroom training with guided practice on tools and real datasets, GDI's Data Analytics course may be worth considering, especially if you prefer learning in-person with direct doubt-solving rather than self-study alone.
FAQs
Do I need a coding background to learn data analytics?
No. Data analytics is beginner-friendly, and many learners start with Excel and SQL before moving to Python. Coding becomes easier once you understand the logic behind data analysis first.
How long does it take to become job-ready in data analytics?
This depends on your prior background, practice hours, and how quickly you build a portfolio. Rather than a fixed number, focus on completing the full learning path and having solid projects to show, since consistency matters more than speed.
Is Excel still relevant if I learn Python and SQL?
Yes. Excel remains widely used for quick reporting and smaller datasets, even in companies that also use Python and SQL for larger analysis. It is rarely replaced entirely.
Can commerce or arts students take up data analytics?
Yes. Data analytics does not require an engineering degree. Strong logical thinking, curiosity about numbers, and willingness to practice tools consistently matter more than your academic background.
What is the difference between a data analyst and a business analyst?
A data analyst focuses more on working directly with data, queries, and dashboards, while a business analyst focuses on understanding business processes and using data insights to recommend decisions. The roles often overlap in smaller companies.
Should I learn Power BI or Tableau first?
Both are strong visualization tools with similar core concepts. Power BI is widely used in Indian companies working with Microsoft products, so many beginners start there, but learning either well makes picking up the other much easier later.
Is certification enough, or do I need real projects too?
A certificate shows you completed a course, but real projects and a portfolio demonstrate that you can actually apply the skills. Employers usually want to see both, so prioritize practical project work alongside your course.
About Graphic Design Institute: Graphic Design Institute (GDI) is a training institute based in Rohini, Delhi, offering practical, classroom-based courses in Data Analytics, Graphic Design, Web Development, Digital Marketing, and more. GDI focuses on hands-on learning with real tools and guided practice to help students build genuine, job-ready skills.
If you are exploring where to begin your data analytics journey in Rohini, reach out to GDI's team to learn more about course structure, tools covered, and batch timings.
Interested in learning more? Explore our Data Analytics course or register now for a free demo class at Graphic Design Institute.